Executive Summary
If your website feels slow, your SEO is usually not “fine.” Google explicitly frames page experience as something its core ranking systems try to reward, and it calls out Core Web Vitals as part of that equation. [1]
Core Web Vitals focus on three user-experience outcomes: loading performance (LCP), responsiveness (INP), and visual stability (CLS). Google also publishes target thresholds: LCP within 2.5 seconds, INP under 200 ms, and CLS under 0.1. [2]
To improve website load times in a way that actually moves SEO results, you need two things at once: reliable measurement (field and lab data) and disciplined execution (images, caching, CDN, minification, server response time, and mobile-first performance). Google Search Console’s Core Web Vitals report is based on real user data and groups URLs by status (Good / Needs improvement / Poor). [3]
This article is a compendium-style playbook: what matters, how to measure it, and a practical checklist your team can act on. It is written for business owners and teams evaluating an SEO web design partner like eLink Design.
Why load time is an SEO issue, not just a developer issue
There is a quiet assumption many companies make: “If our site looks good, SEO will sort itself out.” That is optimistic, at best. Search Engine Optimization is not just content and keywords anymore. A page can be well written and still lose because it frustrates users.
Google’s public guidance makes the direction clear: It’s ranking systems look to reward content that provides a good page experience, and it recommends site owners focus on “overall great page experience across many aspects.” [4]
Here is the practical translation for companies: A searcher clicks your result. If your page is slow, janky, or shifts around while they are trying to read, they back out. That behavior is not a great sign for your business, and it is not aligned with what Google is trying to surface. Google also says Core Web Vitals are used by its ranking systems, while cautioning that “perfect scores” do not guarantee top rankings and should not be the only focus. [4]
The slightly edgy truth: Google is not grading your intentions; it is grading your milliseconds.
Core Web Vitals and the page speed metrics that actually matter
When someone says “our website load times are bad,” the best response is: “Which part of the experience is bad?” Core Web Vitals give you a clean framework.
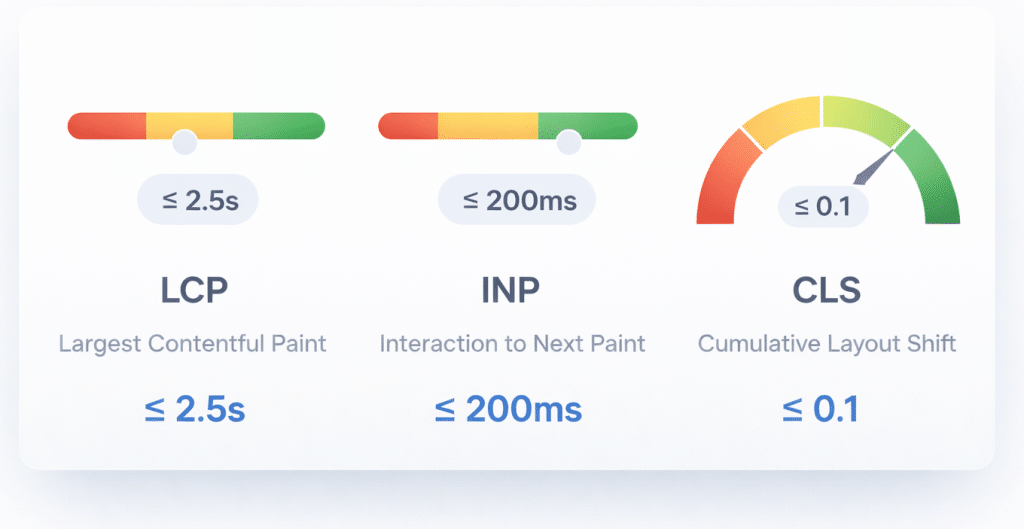
Google’s Core Web Vitals metrics and recommended targets: [2]
| Metric | What it reflects | Good target |
| LCP (Largest Contentful Paint) | How fast the main content appears | <= 2.5 seconds [2] |
| INP (Interaction to Next Paint) | How responsive the page feels during interactions | < 200 ms [2] |
| CLS (Cumulative Layout Shift) | Whether the page visually jumps around | < 0.1 [2] |
But you will also hear teams talk about “page speed” in broader terms. That is not wrong. Think of it as a stack:
Field metrics tell you what real users experience.
Lab metrics tell you what the page can do in a controlled test.
A few supporting metrics that help diagnose problems:
Speed Index (WebPageTest) helps describe how quickly the visible parts of the page are populated; lower is better. [5]
Lighthouse provides additional performance auditing and scoring, where metrics like LCP and CLS are heavily weighted in the performance score. [6]
The goal in SEO web design is not to chase one number. It is to create a page that loads quickly, responds instantly, and behaves predictably, especially on mobile.
Tools and measurement: how to stop guessing and start improving
The fastest way to waste time in Search Engine Optimization is to optimize what you did not measure. The good news is that Google and the broader web performance community provide excellent tooling.
The measurement toolkit we recommend
Google Search Console – Core Web Vitals report
This report groups URL performance by status and metric type (CLS, INP, LCP), and it is based on actual user data. [3]
If you want a business-friendly dashboard of “where are we failing,” this is a strong starting point.
Chrome UX Report (CrUX)
CrUX is a dataset reflecting how real-world Chrome users experience popular destinations on the web, and it represents the user-centric Core Web Vitals metrics. [7]
This matters because it pushes teams away from “my laptop loads it fast” and toward real users on real networks.
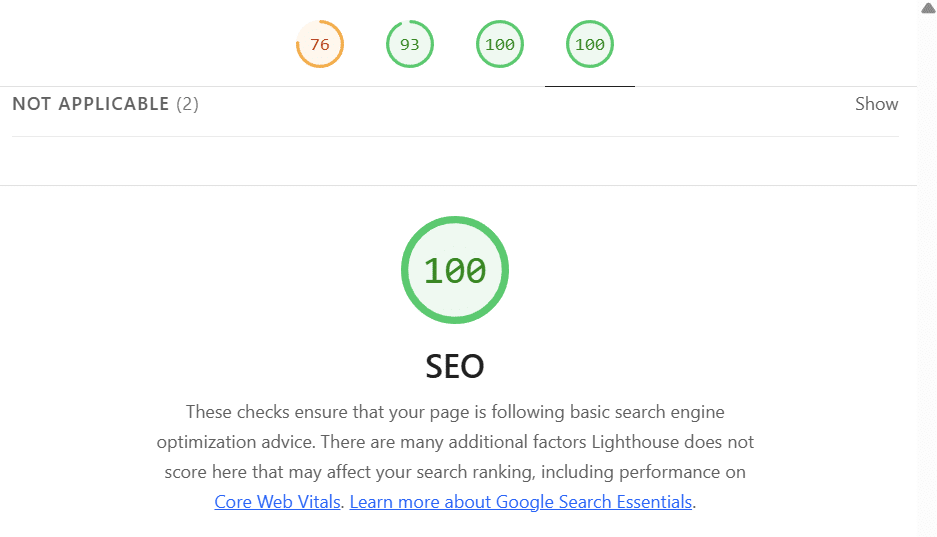
Lighthouse
Lighthouse has audits for performance, accessibility, SEO, and more, and you can run it via PageSpeed Insights, Chrome DevTools, command line, or as a Node module. [8]
Lighthouse is excellent for diagnosing issues and generating a prioritized to-do list.
PageSpeed Insights (API option for automation)
Google’s PageSpeed Insights API returns real-world data from CrUX and lab data from Lighthouse (with API notes about CrUX data availability and recommended CrUX APIs). [9]
This is useful when you want to monitor page speed trends across templates or key landing pages.
WebPageTest
WebPageTest helps you dig into metrics like Speed Index and visualize how the page appears over time. Its documentation defines Speed Index as the average time at which visible parts of the page are displayed. [5]
This is especially valuable when the page “technically loads” but still feels slow.
Which metrics should you report to leadership?
For Search Engine Optimization and SEO web design decisions, keep your reporting tight:
Core Web Vitals (LCP, INP, CLS) as the primary scoreboard. [10]
A small set of diagnostics that explain why: server response behavior, image weight, JavaScript blocking, caching behavior, and mobile performance.
Avoid the trap of dumping a 30-metric dashboard on leadership. That is not analytics; it is noise.
Best-practice checklist: how to improve website load times without breaking your site
This is the compendium section: the practical “do this, then this” list. Not all of it applies to every website, but most sites will find multiple wins here.
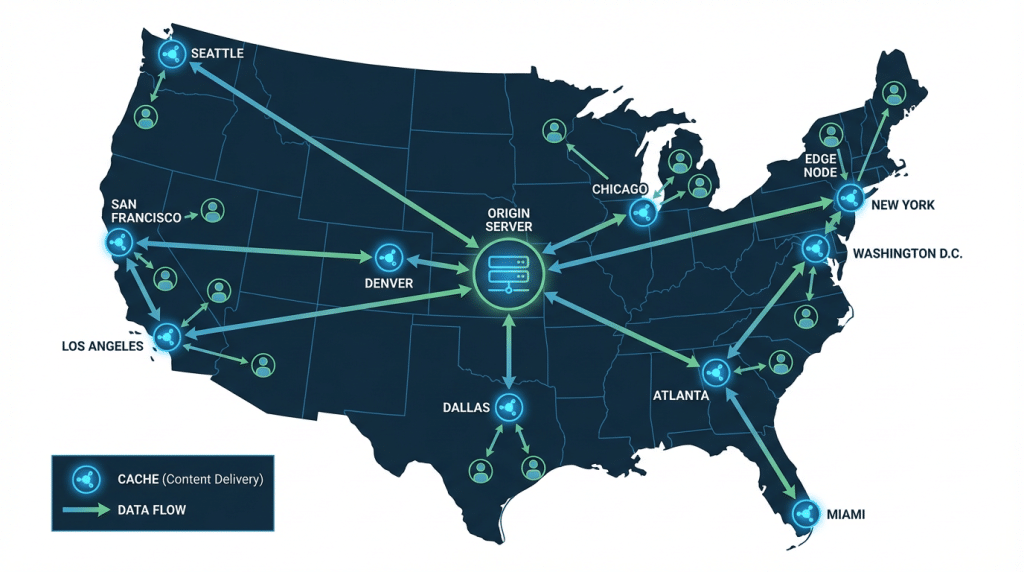
CDN and edge caching
Use a CDN to cache static assets and reduce latency by serving content from a location closer to the visitor. Cloudflare explains that a CDN improves latency by caching content in a distributed network and serving it from the closest data center. [11]
This is especially important for U.S. businesses serving customers across regions. Louisville to Los Angeles is not “close” on the network.
Practical steps:
- Put images, CSS, JavaScript, fonts, and other static files behind a CDN.
- Cache what you can. Be deliberate about what must remain dynamic.
Image optimization and media discipline
Images are often the largest contributors to payload weight.
Practical steps:
- Compress images and use appropriately sized variants for different breakpoints.
- Prefer modern formats where supported.
- Avoid huge hero images that block LCP. Your “pretty” header can be the reason your SEO web design is underperforming.
Caching and cache-control basics
Caching is not only a performance tactic; it is a cost tactic (bandwidth and server load). Use browser caching for static assets and reduce repetitive downloads for returning visitors.
Practical steps:
- Set sensible cache lifetimes for versioned assets.
- Use a fingerprinted filename strategy for CSS and JS so you can cache aggressively without breaking updates.
Lazy loading, but do it carefully
Lazy loading reduces initial load by deferring images or content not visible above the fold. But you must not lazy load the content Google needs to understand the page.
Practical steps:
- Lazy load below-the-fold images.
- Keep the primary content (and the primary image or hero element) prioritized to protect LCP.
Minification and reducing render-blocking resources
Lighthouse scores show that LCP and CLS have significant weight in performance scoring, and Total Blocking Time also has meaningful weight as a lab indicator. [6]
Large, blocking scripts and unminified CSS can destroy performance.
Practical steps:
- Minify CSS and JavaScript.
- Remove unused CSS and JavaScript.
- Split bundles so each page only loads what it needs, not the whole application.
Server response and backend performance
You cannot “front-end optimize” your way out of a slow server.
Practical steps:
- Reduce time spent generating HTML (database queries, heavy CMS plugins, expensive API calls).
- Use server-side caching where appropriate.
- Evaluate hosting services and infrastructure when TTFB or server response is the clear bottleneck.
Mobile-first performance and mobile-first indexing reality
Performance expectations are even higher when businesses expand into mobile app development alongside their web presence.
Google’s guidance is blunt: it uses the mobile version of a site’s content (crawled with a smartphone agent) for indexing and ranking. [12]
If your mobile experience is a watered-down version of your desktop site (or slower), you should expect consequences.

Practical steps:
- Build responsive layouts that do not hide critical content on mobile.
- Treat mobile performance as the default target, not an afterthought.
- Test on real devices on real networks, not just desktops on fast Wi-Fi.
Advanced: resource hints for critical origins
When used carefully, resource hints can reduce connection setup costs (DNS, TCP, TLS) for critical third-party origins.
The W3C Resource Hints specification defines relationships like dns-prefetch, preconnect, prefetch, and prerender to help user agents decide which origins to connect to or fetch in advance to improve page performance. [13]
Practical steps:
- Use preconnect for only the most critical third-party origins.
Audit third-party tags. Too many “helpers” on the page often create the very performance problems you are trying to solve.
Kentucky note: why page speed keeps showing up in local wins
eLink Design is based in Kentucky, and a lot of Kentucky businesses are fighting for attention in competitive local markets like Lexington and Louisville.
Local SEO often comes down to simple things executed consistently: strong service pages, clean technical SEO, and fast mobile experiences. When a Kentucky customer searches on a phone from a parking lot, they are not in the mood for a slow-loading page that jumps around. If your site loads quickly and your competitors do not, your “website load times” become a quiet advantage that compounds over time.
How eLink approaches SEO web design performance
The best SEO web design work — especially for complex websites and web-based application development projects — is not magic. It is process.
At eLink, performance improvements typically follow a pattern:
- Audit key templates and top landing pages using field and lab data (Search Console, CrUX, Lighthouse). [14]
- Prioritize changes that impact LCP, INP, and CLS first, because those are the user-visible outcomes that matter to Search Engine Optimization. [10]
- Fix foundations (server response, caching, CDN) before polishing the surface (micro-optimizations).
- Verify with measurement after each release, because performance regressions are common when marketing or feature updates roll out.
If you are evaluating a partner, the best question to ask is not “can you make our site fast” but “how will you prove it got faster, and how will you keep it that way?”
If you want to discuss how this applies to your site, contact our team.
Andrew Chiles
CEO, eLink Design
Sources:
Google Search Central (Page experience + Core Web Vitals):
https://developers.google.com/search/docs/appearance/page-experience
https://developers.google.com/search/docs/appearance/core-web-vitals
https://developers.google.com/search/docs/crawling-indexing/mobile/mobile-sites-mobile-first-indexing
Chrome for Developers (Lighthouse + CrUX):
https://developer.chrome.com/docs/lighthouse/
https://developer.chrome.com/docs/lighthouse/performance/performance-scoring/
https://developer.chrome.com/docs/crux
WebPageTest documentation (Speed Index definition):
https://github.com/catchpoint/WebPageTest.docs/blob/main/src/metrics/SpeedIndex.md
Cloudflare Learning Center (CDN performance and caching):
https://www.cloudflare.com/learning/cdn/performance/
W3C specification (Resource hints):
https://www.w3.org/TR/2023/DISC-resource-hints-20230314/
[1] [4] Understanding Google Page Experience | Google Search Central | Documentation | Google for Developers
https://developers.google.com/search/docs/appearance/page-experience
[2] [10] Understanding Core Web Vitals and Google search results | Google Search Central | Documentation | Google for Developers
https://developers.google.com/search/docs/appearance/core-web-vitals
[3] [14] Core Web Vitals report – Search Console Help
https://support.google.com/webmasters/answer/9205520?hl=en&utm_source=chatgpt.com
[5] WebPageTest.docs/src/metrics/SpeedIndex.md at main – GitHub
[6] Lighthouse performance scoring | Chrome for Developers
https://developer.chrome.com/docs/lighthouse/performance/performance-scoring
[7] Overview of CrUX | Chrome UX Report | Chrome for Developers
https://developer.chrome.com/docs/crux?utm_source=chatgpt.com
[8] Lighthouse | Chrome for Developers
https://developer.chrome.com/docs/lighthouse/?utm_source=chatgpt.com
[9] Get Started with the PageSpeed Insights API | Google for Developers
https://developers.google.com/speed/docs/insights/v5/get-started?utm_source=chatgpt.com
[11] CDN performance – Cloudflare
https://www.cloudflare.com/learning/cdn/performance/?utm_source=chatgpt.com
[12] Mobile-first Indexing Best Practices | Google Search Central …
[13] Resource Hints – World Wide Web Consortium (W3C)
https://www.w3.org/TR/2023/DISC-resource-hints-20230314/?utm_source=chatgpt.com